
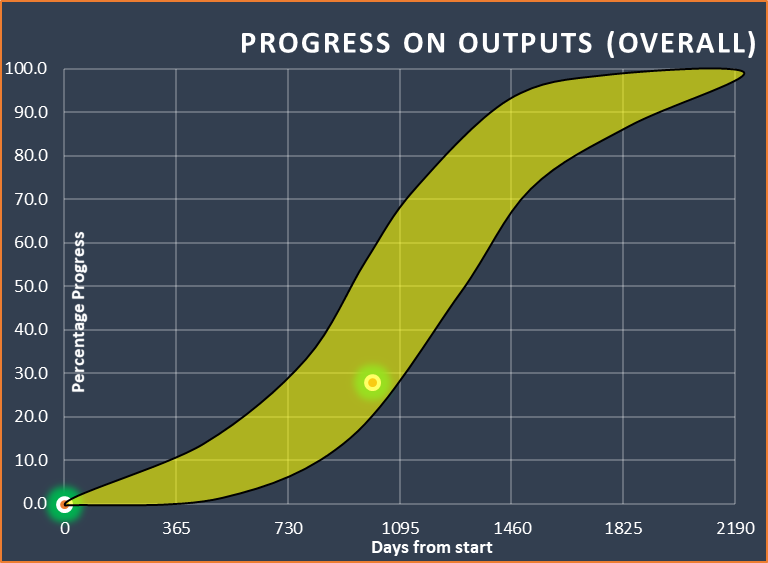
The Prosperity project’s first round of Results-Based Monitoring are completed, and they show an overall Activity to Output Monitoring (ATOM) score of 28 in the five components. Individually, Nutrition component scored highest 36, followed by Livelihoods and Disaster & Climate Resilience Building 27, Community Mobilisation 21, Disability Inclusion 17, and Women Empowerment leading to Gender Equality 11 (Fig 1). The project will conduct similar RBM each year to track progress against inputs and take corrective measures accordingly.
Fig 1: Progress on outputs: S-Curve
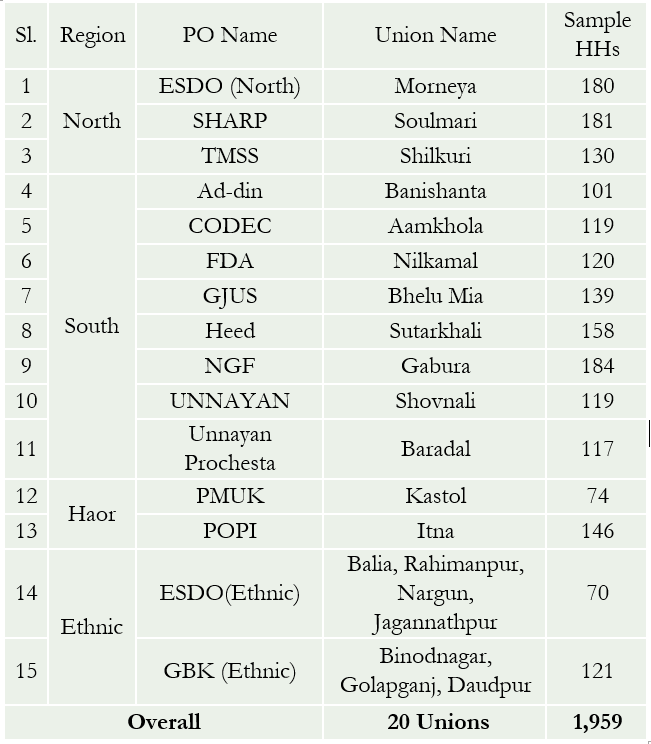
Data collection for RBM was done during November-December 2021 across all four working regions with a pre-tested questionnaire. The total sample size was 1,959 out of 35,229 households, randomly drawn from half of the 7,642 Prosperity Village Committees (PVCs). Of the sample households, also selected randomly, 30% were selected from among those who received IGA training and grants and the rest 70% from among those who received all project support except for skills training and grants support.
Table 1: Results-Based Monitoring Sampling
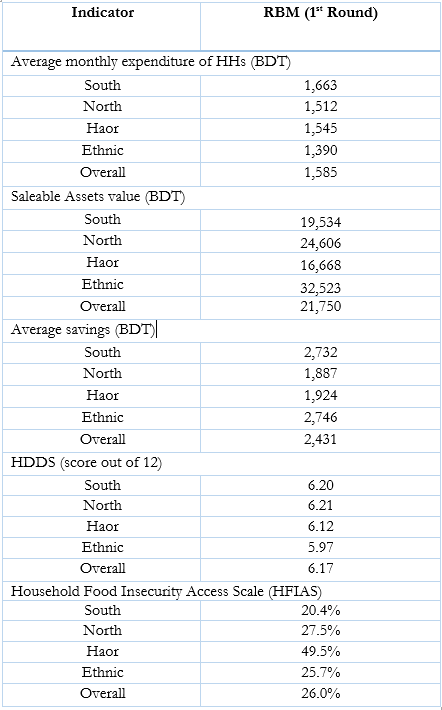
Findings show, participant households have now improved food and nutrition security and a slightly higher income and expenditure by about BDT 500-600 per month on average, although it varies a little in different geographic regions. In terms of their saleable assets, RBM results found considerable improvement across the regions, with average saleable assets now standing at BDT 21,750, which is about BDT 8,000 higher than it was at the time of their enrolment in the programme in 2019-2020. The Household Dietary Diversity Score is 6.17 (out of 12 scale) and 26% households have been found to be food insecure (HFIAS). Table 2 presents Impact and Outcome level indicators, Table 3 shows region-wise income as well as stunting and wasting and Table 4 presents region-wise outcome level indicators.
Table 2: Impact and outcome level indicators
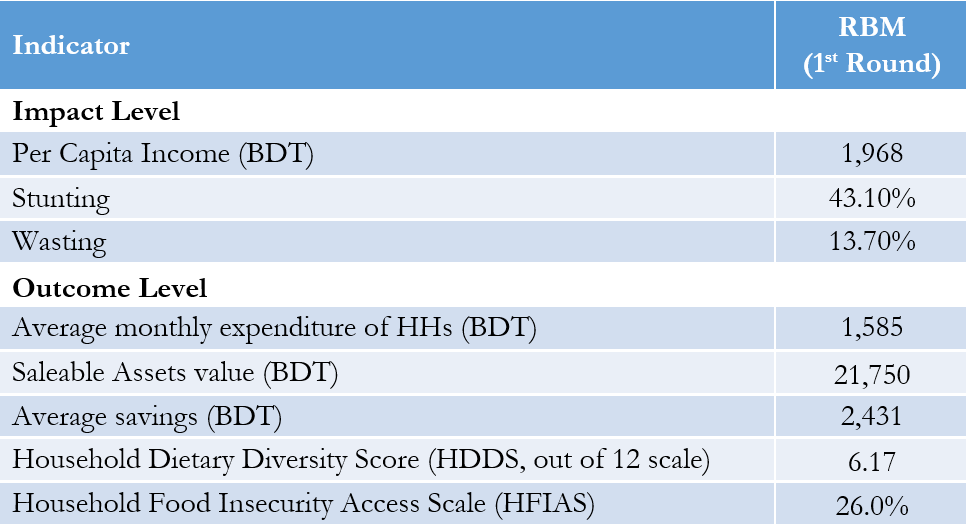
Table 3: Impact level indicators by region
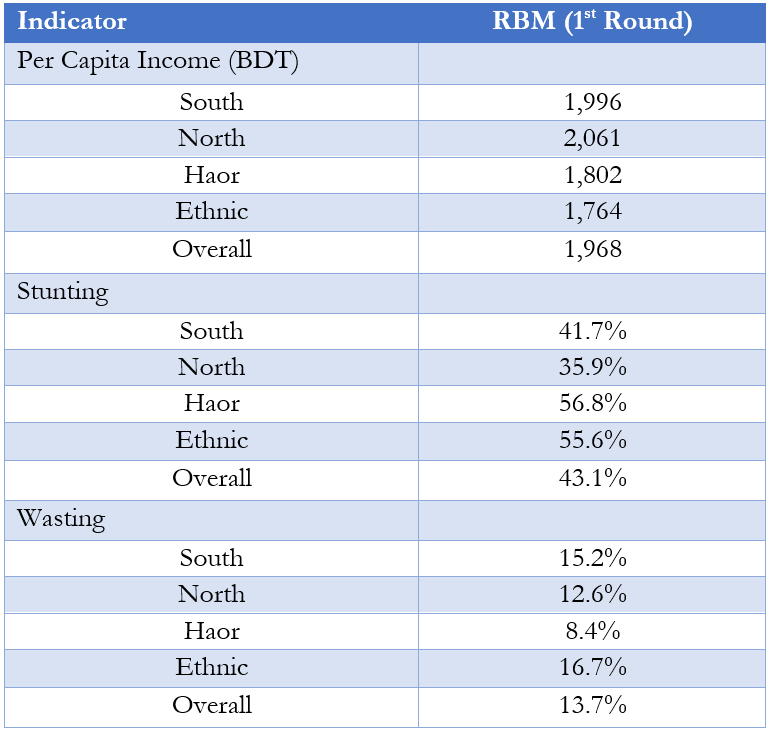
Table 4: Outcome level indicators by region